
The Tsunami Flood Modelling Video was commissioned as part of the Ucluelet Flood Mapping Project to demonstrate the effects a tsunami wave could have on Ucluelet. The video depicts the predicted outcomes of the two modelled Tsunami events completed as part of the project. The video was created using a 3-D laser scanning techniques and orthographic imagery by Andrew Plowright.
Scenario V1 - No Tsunami (0.08s)
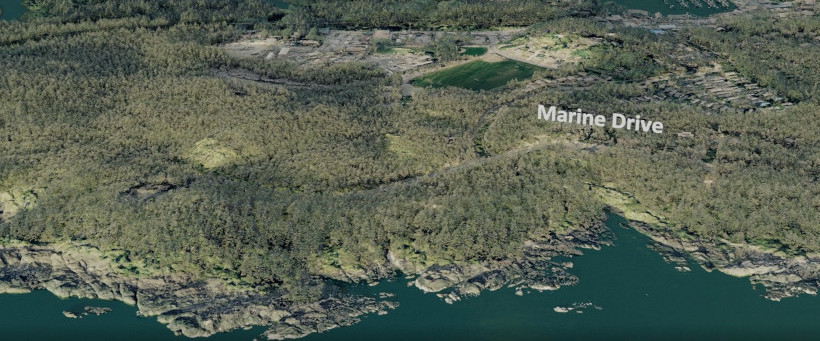
The first part of the video looks over the Ucluelet Peninsula without any rise in the sea level and shows what we typically see near high tide. Note the clarity of the information with the forests, roads, buildings and even hydro lines being visible and to scale.
Scenario V2 - Smaller Tsunami (0.53s)
The second scenario shown in the video models the sea level rise of a buried rupture fault event along the Cascadia Subduction Zone. This comparative case model has been used in previous studies and allows the results to be compared with other tsunami flood hazard maps from around the region. This model simulation also corresponds to the lower end of the tsunami amplitudes that can be expected, with the least impact to the shore.
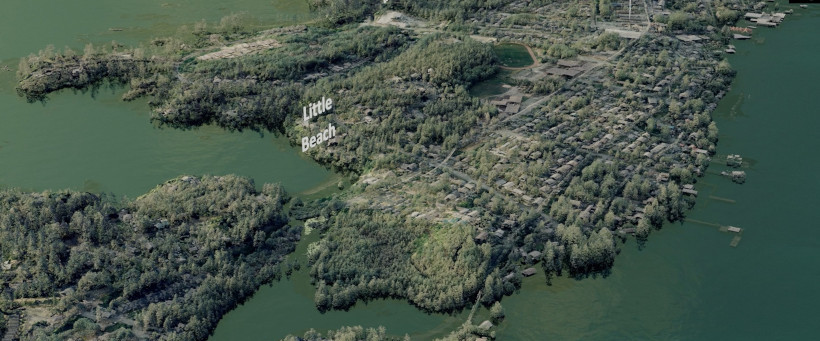
In this model, the water level has now gone inland, and you can see the reflections within the trees and in amongst the buildings. It is important to note where water is now visible across roads and highways so that you can organize a personal and neighbourhood emergency plan.
Scenario V3 - Larger Tsunami (1min 35s)
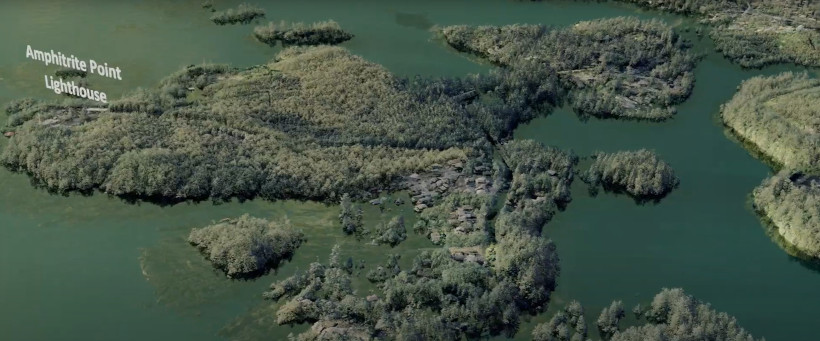
Sea level is increased further using a worst-case (relative to this project only) splay faulting rupture model in the final part of the video. This higher water level further affects the community’s roads and infiltrates even more inland.
We hope this demonstration video will emphasise the importance of personal, neighbourhood, and community preparedness and inform on the need to integrate emergency planning into current and future land use decisions.
More Information
Section 6 of the Final Report and the Map Atlas (Appendix C) contains more in-depth information on the Tsunami Flood Hazards affecting Ucluelet and the models used to predict the sea level rises.
If you have any comments or questions regarding the Flood Mapping Project, please contact Bruce Greig or John Towgood in the Community Planning Department.
Disclaimer
The content in this video has been simplified for visualisation purposes. The terrain and water levels represented here may not exactly match the modelled tsunami flood scenarios. For example, the calm water in the video only indicates the maximum water levels (as still water). The actual tsunami waves approaching and overtaking the coastline are not shown. The tsunami visualisations include 1m of relative sea level rise caused by climate change.
Please refer to the Coastal Flood Mapping Report for details on methods, results, and map outputs. Ebbwater Consulting Inc. and Cascadia Coast Research developed the flood mapping in accordance with generally accepted engineering practices and with full understanding of applicable natural hazard and mapping guidelines in the Province of British Columbia. The mapping outputs were developed for the District of Ucluelet, and the consulting team denies any liability to others.